Graphs - of Audio Samples from modem. Try to decode audio exported from Audacity using this page.
This experimental page started off experimenting with the CANVAS for drawing and audio.
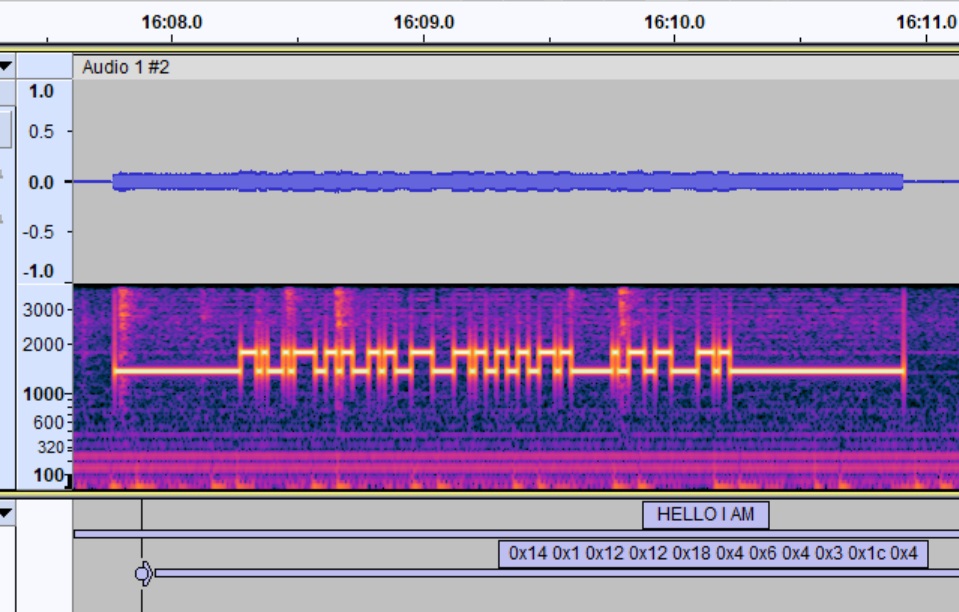
Audacity was used to record the audio off the phone line that the modem is plugged into.
Audacity does not decode BAUDOT or V.21, so use this experimental page to decode exported audio samples to the Text sent.
This page uses IIR filters to look for tones and a 50 baud UART. The red lines are the IIR output, the blue lines are debug. It is experimental.
Looking for BAUDOT , STOP , start , 1,0,0,0, 0 1
The modulation is frequency shift-keyed modulation (i.e. no carrier is present when a character is not
being transmitted) using 1400 Hz (±5%) for a binary 1 and 1800 Hz (±5%) for a binary 0. A bit
duration of either 20 or 22.00 ± 0.40 ms is used providing either a nominal data signalling rate of
50 or 45.45 bits/s respectively.
BAUDOT only has 5 holes so shift between letters LTRS and numbers FIGS
//2024/01/16 changed l to @, and f to #, so I can use toUpperCase()
// simple look up to find the BAUDOT code.
// use @ for 0x1F SHIFT to LTRS. Use # for 0x1B SHIFT to FIGS
var BD_letters =".E.A SIU.DRJNFCKTZLWHYPQOBG#MXV@"
var BD_figure  =".3.- -87-$4.,!:(5.)2=6019?+#./;@"


  BAUDOT: - 5 bit
* carrier (for 150ms) + 0 + 11000 + 1 (for 40ms)
*
* 0 - 1800Hz - SPACE
* 1 - 1400Hz - MARK
* START 0
* STOP  1
*
Filters , Energy levels, comparator, UART, look up table
This exprimental web page was used to decode modem signals, recorded using Audacity. A version for V.21 was adapted to decode BAUDOT.
   input -+--[ filter ]--[ energy ]--+
          |                          [ 1/0 ? ]--[ UART ]--[ BAUDOT to ASCII lookup ] --- output ,as Letters & Numbers & Hex
          +--[ filter ]--[ energy ]--+


 8000 samples per seconds
 300 baud = 26.667
 UARTS normally use a x16 clock
 300 x 16 is 4800Hz clock

 BAUDOT used 50, 47.5, 45.45 BAUD.
 UART - for each time slice increment t
 START,bit0,1,2,3,4,5,STOP
 use a count down state machine
 0 - stop
 1

 You need to Shift between LTRS for Letters and FIGS for numbers

	// simple look up, I could return a char that means a special. SHIFT ltrs l SHIFT FIGS f
	var BD_letters =".E.A SIU.DRJNFCKTZLWHYPQOBGfMXVl"
	var BD_figure  =".3.- -87-$4.,!:(5.)2=6019?+f./;l"


    //2024/01/16 changed l to @, and f to #, so I can use toUpperCase()
	// simple look up, I could return a char that means a special. SHIFT to LTRS @ 0x1F , SHIFT to FIGS # 0x1B
	var BD_letters =".E.A SIU.DRJNFCKTZLWHYPQOBG#MXV@"
	var BD_figure  =".3.- -87-$4.,!:(5.)2=6019?+#./;@"

    // decode shifted and unshifted	and display both
    UART.bytesCharsBDl += ""+BD_letters.substr( ( UART.byte  )  , 1 );
    UART.bytesCharsBDn += ""+BD_figure.substr(  ( UART.byte  )  , 1 );

 The filter function uses an iir filter.

 The energy is measured using the delayed output squared.

  // take 4 samples
  opA[ i ] =
    z[0]*z[0]
	+z[1]*z[1]
	+z[2]*z[2]
	+z[3]*z[3]

 One of the filters resonated with amplitude about half of the other one so it is doubled.

/*
*
* iir filter.
*

--X---[ z-1 ]----[z-1]-----
  |            |           |
  |				k	       -1
  |            |           |
  \------------------------

from wikipedia:-

Nterms defined here
Kterm selected here
ω = 2 * π * Kterm / Nterms;
cr = cos(ω);
ci = sin(ω);
coeff = 2 * cr;

sprev = 0;
sprev2 = 0;
for each index n in range 0 to Nterms-1
  s = x[n] + coeff * sprev - sprev2;
  sprev2 = sprev;
  sprev = s;
end

power = sprev2*sprev2 + sprev*sprev - coeff*sprev*sprev2 ;

Z = exp( j 2 * π * f / Fsample rate );

exp( j 2π * f / Fsample rate ) = cos( j 2π * f / Fsample rate ) + j sin( j 2π * f / Fsample rate );

If the IIR uses two poles , just within the Unit circle, it resonates. Tune it to look for 1800Hz or 1400Hz.

In a sampled system the frequency domain wraps into the unit circle.

*
*/


/*
* https://sites.google.com/site/hobbydebraj/goertzel-algorithm-dtmf-detection
*/

var z1= "0,0,0,0".split(",")
var z2= "0,0,0,0".split(",")

var mag = 0.83 // pole just inside the unit circle.

var k1= "0.5,-0.7,0.2,0.2".split(",")
    k1[0] = mag*2.0*Math.cos(  2.0*Math.PI*( 1800*1.0/8000.0) )
    k1[1] = -mag*mag

var k2= "0.5,-0.7,0.2,0.2".split(",")
    k2[0] = mag*2.0*Math.cos(  2.0*Math.PI*( 1400*1.0/8000.0) )
    k2[1] = -mag*mag

 function iir2_ts( i, ip,z, k, opA ){

  z[3]=z[2]*1.0
  z[2]=z[1]*1.0
  z[1]=z[0]*1.0
  z[0]= ip*1  +k[0]*z[1]   +k[1]*z[2]

  // take 4 samples
  opA[ i ] =
    z[0]*z[0]
	+z[1]*z[1]
	+z[2]*z[2]
	+z[3]*z[3]

}